Tax and
Risk Efficient
Wealth Services
Schedule a conversation
Why would you pay 1% or more for Wealth Services without these four core elements?
A Fiduciary Promise
Read oursWhat can you expect from WealthFactor? We are a team of real experts committed to helping you steward your wealth well, always with your best interest first.
Bill Woodruff
WealthFactor Managing Director, CIO
A Team of Experts & Planners
 Bill Woodruff, CAIA
 Peter Buss, CPA
 Brie Valant
 Alan Ford
Holistic Wealth Services
Wealth Plan
Pricing: $5,500 and up
Our planner(s) and experts will craft a personalized holistic Wealth Plan.

Access to Subject Matter Experts
Dedicated Wealth Planner
Holistic Wealth Plan
- Financial Plan
- Investment Plan
- Tax Plan
- Estate Plan

Reporting and Administration
Comprehensive Management
Wealth Management
0.19 - 0.89% on assets
Ongoing access to your team of planner(s) and experts. We’ll steward your wealth.
Access to Subject Matter Experts
Dedicated Wealth Planner
Holistic Wealth Plan
- Financial Plan
- Investment Plan
- Tax Plan
- Estate Plan
Reporting and Administration
Comprehensive Management
Tailored Investing
Too many investors receive cookie-cutter models.
While ETFs are great investment tools and should be used in many cases being limited to them misses opportunities to optimize for tax and risk.

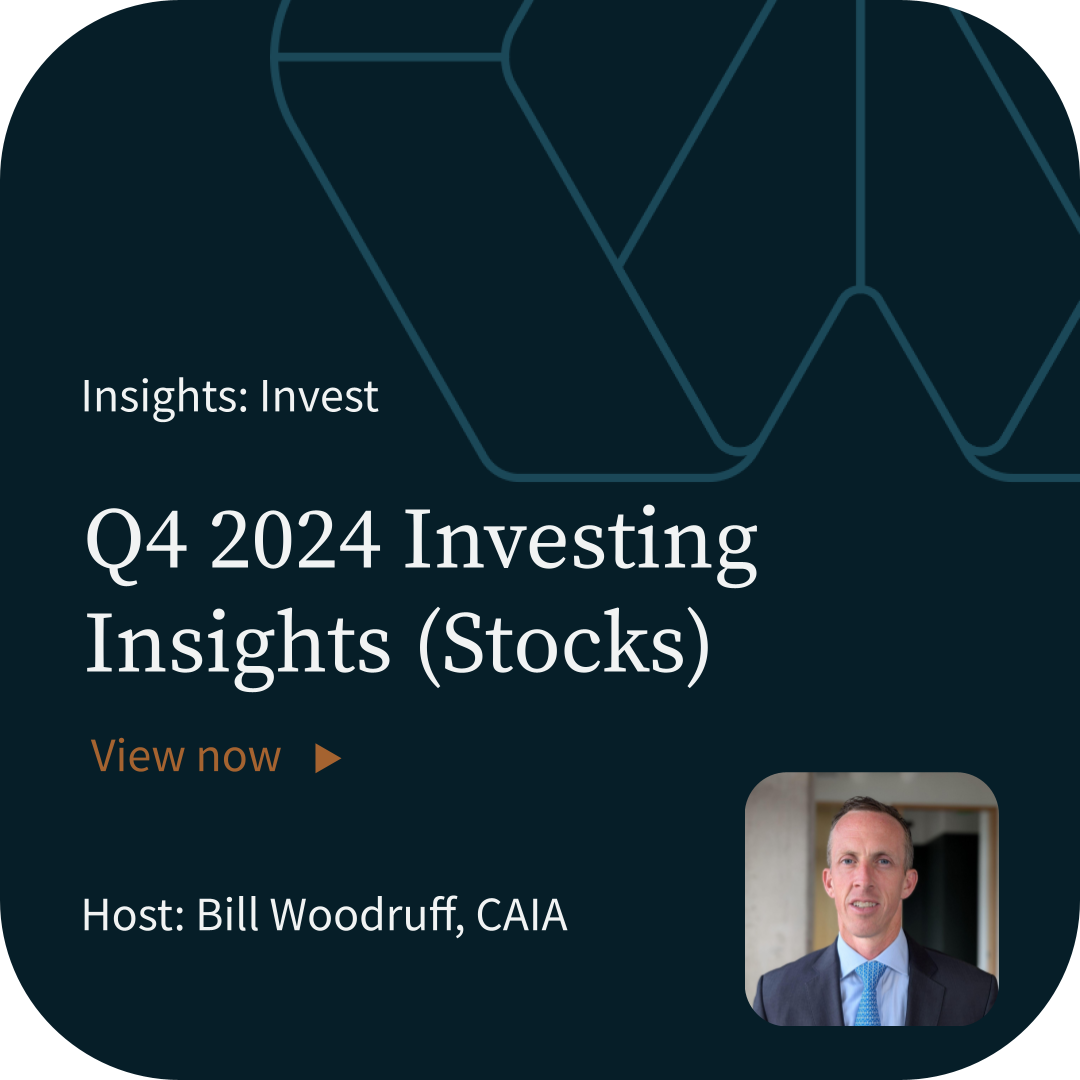
Recent Insights
READ MORE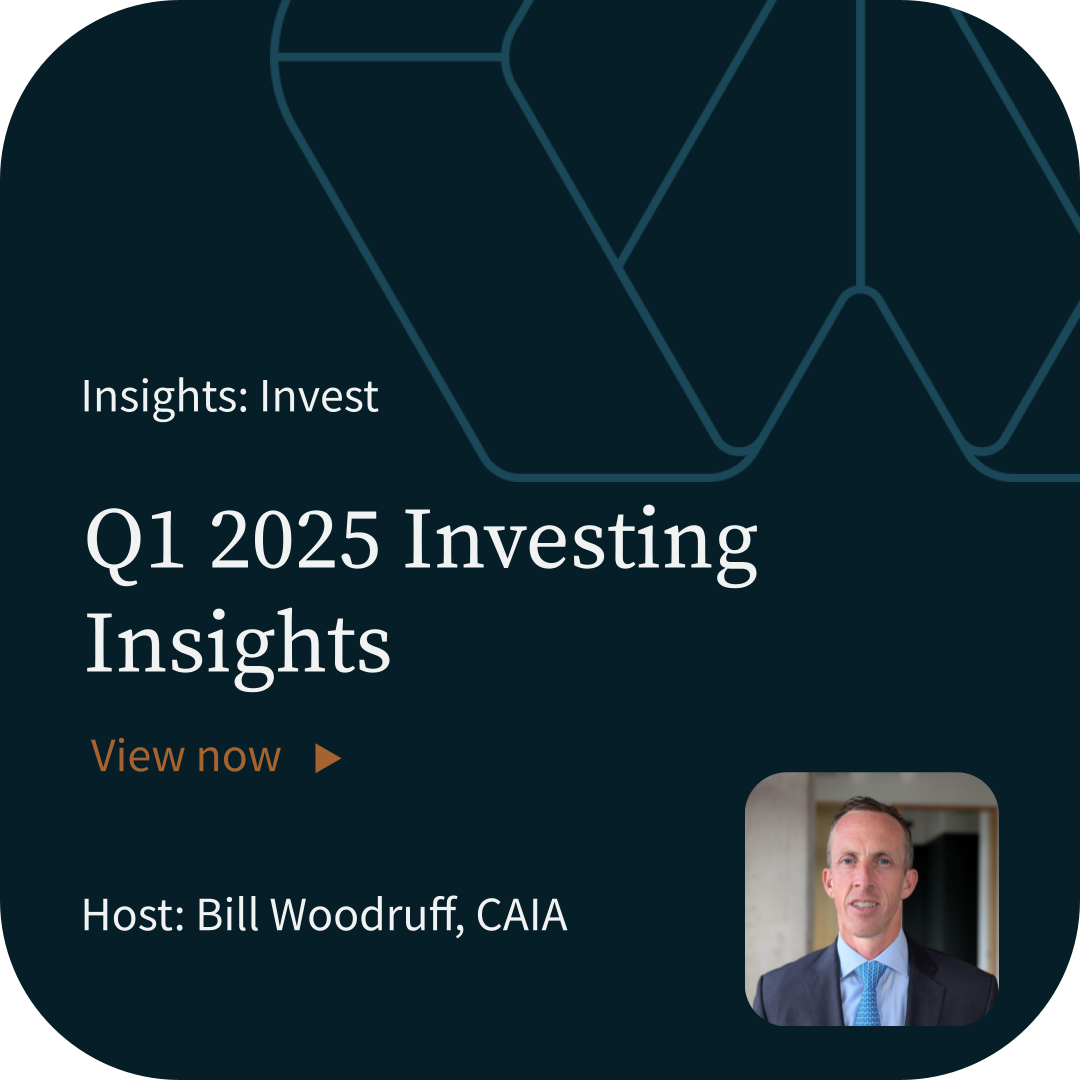


“I came for the free tools (really helpful) and stayed for the expert advice. Thank you WealthFactor.
Kristen C.
Powered by